With election fever spreading across the UK, we thought it would be the perfect time to launch this infographic on the Financial logistics of a snap election. It covers the logistics of running an election, candidate spending, where the money goes and much more.
General elections, local elections and national referendums all come with a unique set of logistical challenges and a substantial cost, so how does a snap election compare when it comes to financial implications?
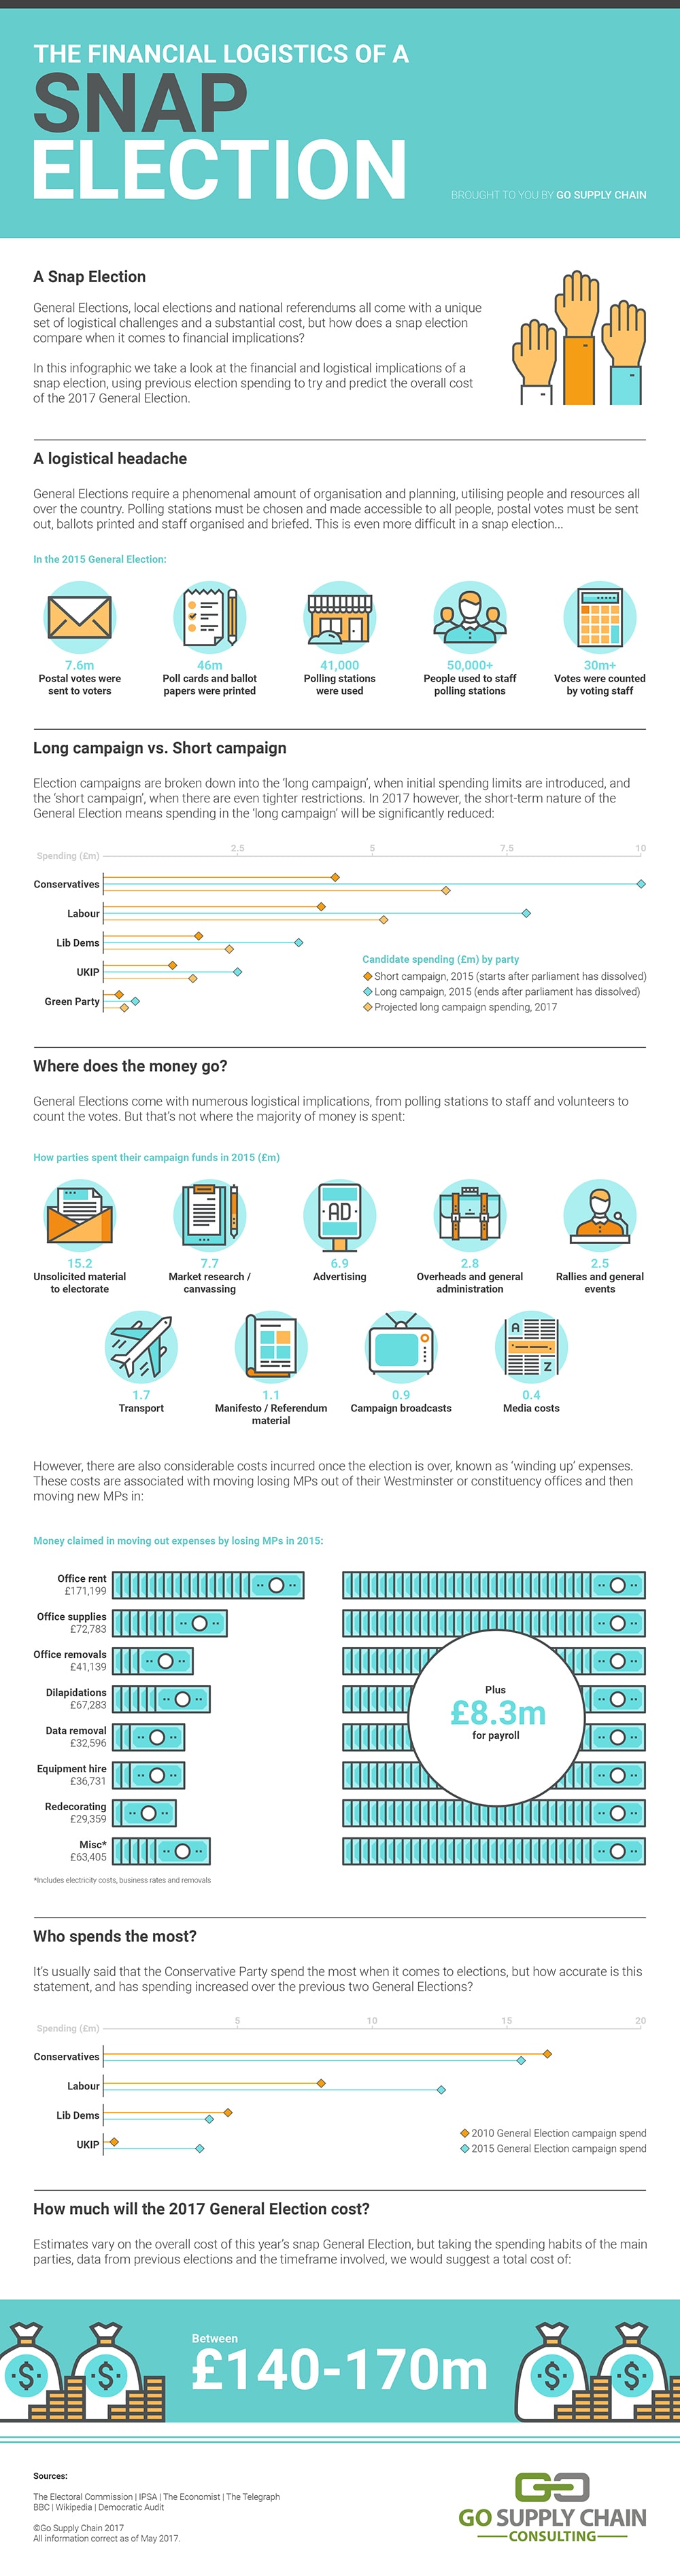
In the 2015 General Election, 7.6m postal votes were sent to voters, 46m poll cards and ballot papers were printed, 41 Polling stations were set up/used, 50,000+ people were used to staff these polling stations and 30m+ votes were counted by voting staff. Those numbers are huge and behind each of these points, there are a number of Logistic Strategies that have been put in place to ensure that every target is met.
Take a look at our infographic and if you have any questions, call our Logistics Consultancy team.